Case Study
ChileAtiende – a multi-channel one-stop shop for public services
26th February, 2016

Read the TOPC sprint toolkit, which includes step-by-step instructions and templates for local governments to replicate the TOPC model on their own.
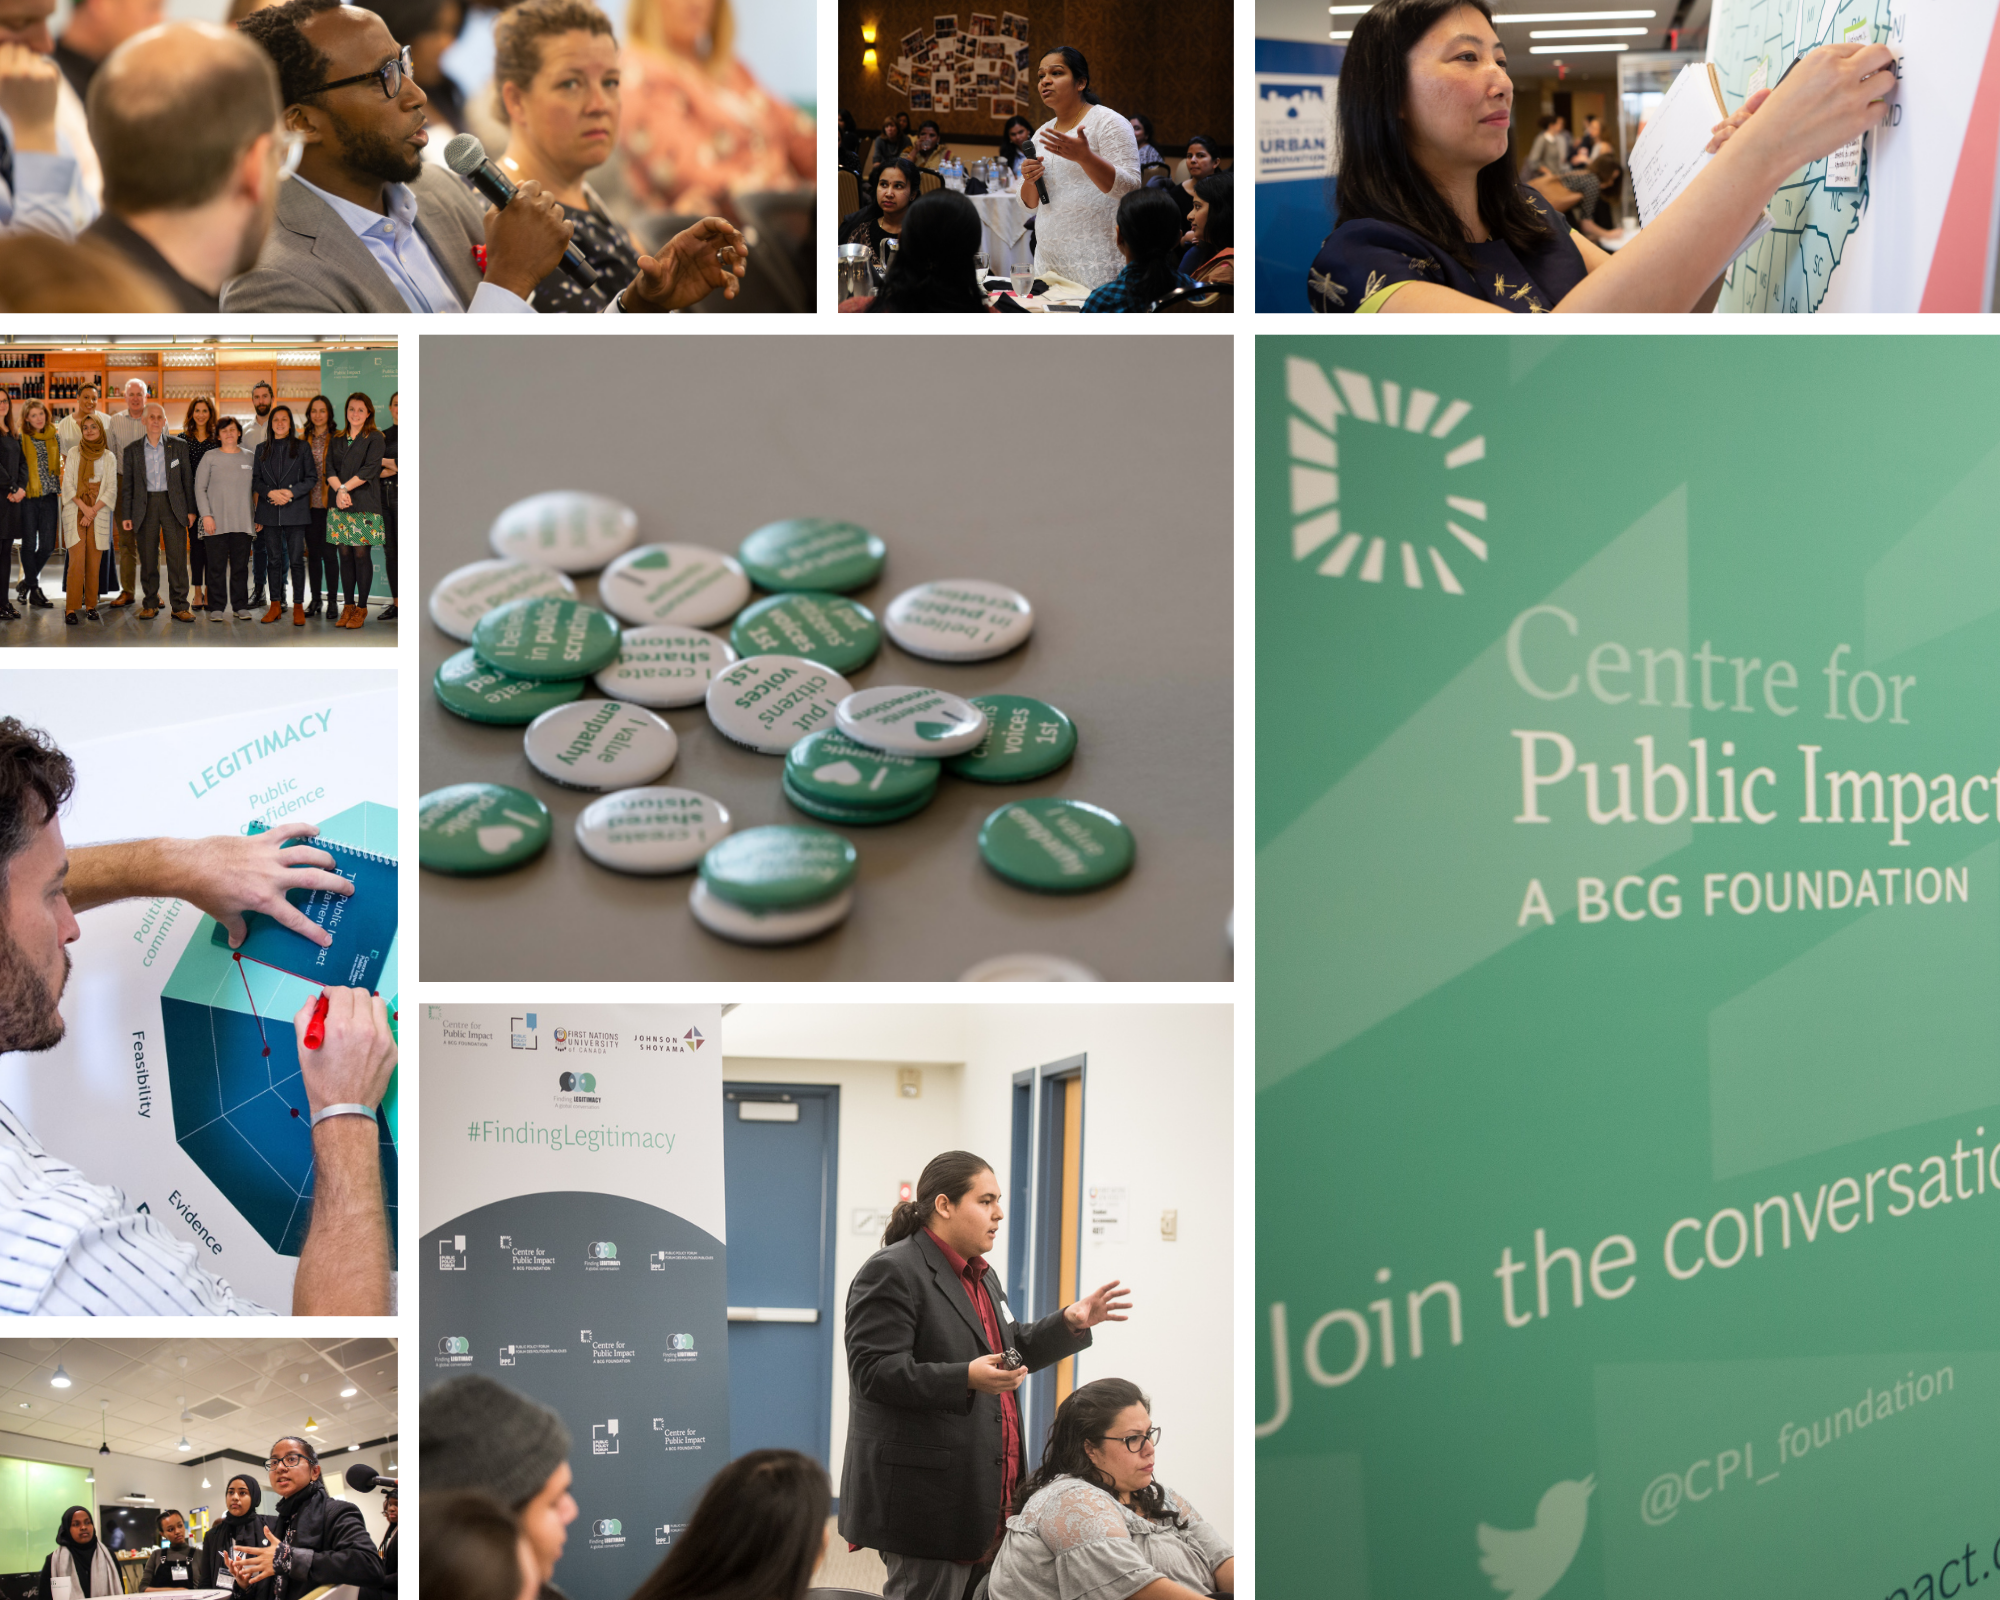
This report was compiled following the second iteration of The Opportunity Project for Cities (TOPC) program, a 22-week innovation sprint designed after the federal initiative, The Opportunity Project. During the sprint, local governments, community leaders, and pro bono technologists from Google.org worked with residents to prototype digital tools that used open data to address local challenges. In the long term, The Opportunity Project for Cities encourages a culture shift to a more transparent, accessible, and responsive government better equipped to positively impact the community. The Centre for Public Impact (CPI) is a non-profit organization founded by Boston Consulting Group to reimagine government to work better for everyone. The Beeck Center for Social Impact + Innovation at Georgetown University reimagines systems for public impact using design, data, and technology. Beeck Center projects test new ways for public and private institutions to leverage data and analytics, digital technologies, and service design to help more people.
CPI and the Beeck Center have developed this joint report to document findings and lessons to inform wider efforts in the field of civic innovation. The report includes four case studies about our participating cities and counties, which includes insights for local governments interested in learning more about an individual team’s journey through the process and learnings for local governments facing similar challenges. The report also includes key lessons that may be helpful for local governments seeking to apply best practices from the TOPC approach. Finally, the report includes a program analysis section that briefly analyzes some of the highlights and opportunities to iterate upon in future TOPC cohorts.
The Opportunity Project for Cities is supported by the John S. and James L. Knight Foundation and receives pro bono technical support from Google.org, Google’s philanthropic arm. This report was written by Brian Zuluaga, Katie Stenclik, Rebecca Ierardo, and Grayson Wiles. It was released on March 14, 2023, under a Creative Commons AttributionShareAlike license and should be cited as: “The Opportunity Project for Cities: Lessons from Detroit, Long Beach, Macon-Bibb, and Miami-Dade County” (2023). Washington, D.C.”
As of 2021, 95 percent of cities and 87 percent of counties surveyed by the Center for Digital Government (CDG) reported that they had created or instituted an open data project. Local governments continue to adopt open-data programs to increase government transparency and accountability, drive civic participation, and ultimately improve residents’ quality of life. Moreover, publicly available data has created opportunities for government and community to work together and strengthen relationships. However, throughout all open-data initiatives, it is still unclear which characteristics or commitments of open-data initiatives will lead to the most substantial impact on local communities.
The Opportunity Project for Cities (TOPC) strives to answer this question by bringing together governments, community leaders, and pro bono technologists from Google.org in a 22-week design sprint to develop an open-data digital tool that addresses local challenges. The program builds governments’ innovation capacity and data maturity in order to develop an open-data minimum viable product (MVP) by the end of the sprint. Critically, the program sets governments and communities on a path of shared power, elevating community member needs through human-centered design and practicing co-ownership through cross-sector collaboration. The relationships developed through the program are essential for maintaining these products long-term and driving the culture shifts that enable governments to meet residents’ most pressing needs. In the long term, TOPC encourages a culture shift to a more transparent and responsive government better equipped to positively impact the community.

Building on the successes and learnings from the inaugural 2021 sprint in San José, CA, and Saint Paul, MN, the 2022 Opportunity Project for Cities expanded to continue to center and explore these themes with our second cohort. In 2022, the program’s cohort doubled in size from two sprint teams to four, included county governments for the first time, extended the sprint by four weeks, and strengthened our commitment to DEIB (Diversity, Equity, Inclusion, and Belonging) through new programming and improved application processes.
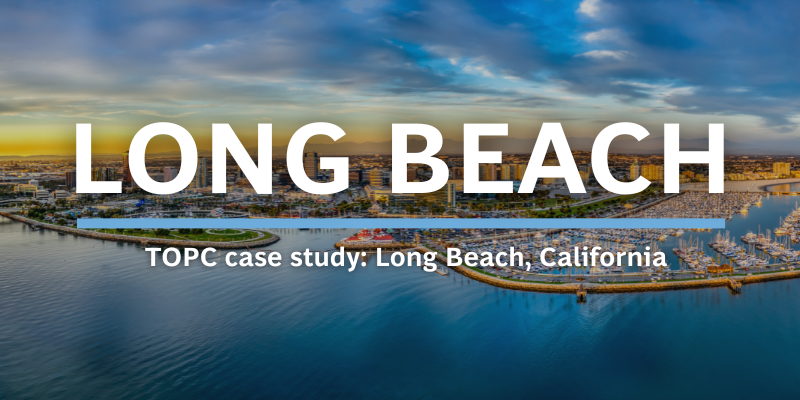
This year’s cohort brought together two cities - Detroit, Michigan, and Long Beach, California - and two counties - Macon-Bibb County, Georgia, and Miami-Dade County, Florida. Participating communities focused on challenges ranging from urban greening to neighborhood blight. See our city/county case studies to learn more about their unique journeys through the program.
Community-centered civic technology has the potential to shift the needle on meeting residents’ needs. We hope that local government digital innovation in the TOPC program will not only bring forth new open-data technology but will foster cultures of government transparency, accessibility, and responsiveness. We hope this strengthens residents' trust and lays the foundation for lasting co-created innovation.
The second TOPC sprint launched in June 2022 with two cities and two counties. With the explicit requirement of advancing equity in their communities, the teams applied focused on the following problem areas:
Detroit, Michigan, aimed to accelerate its digital equity initiatives by improving residents’ experiences with prolonged internet outages.
Long Beach, California, looked to strengthen the community’s climate resilience by expanding urban forest coverage.
Macon-Bibb County, Georgia, sought to support thriving neighborhoods and local residents by removing neighborhood blight.
Miami-Dade County, Florida, planned to support local entrepreneurs and small business owners by lowering the barriers to starting a business.
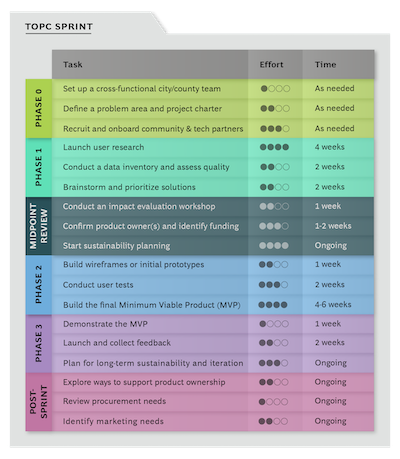
Each community formed cross-sector teams that included local government employees and local community partners who shared expertise on the community perspective and the problem area, as well as helped the sprint team get feedback from residents throughout the sprint. Additionally, Google.org provided pro-bono technical support throughout the project with a cross-functional team of product managers, software engineers, user-experience researchers, product designers, program managers, and marketers. Over five months, the teams engaged in a product design sprint comprised of three main phases: understanding the problem; developing prototypes to address the problem; and launching a digital minimum viable product for public use. During this year’s sprint, teams engaged with community members and reviewed relevant data sets through surveys, interviews, and focus groups to engage with more than 100 residents. They then used these insights to inform the creation of four local products.
Our TOPC toolkit provides a more detailed description of how this program works in practice so that local governments can replicate TOPC sprints on their own. The rest of this section describes how each locality addressed its problem through the sprint and lessons learned. Governments that are looking to tackle similar problems can dive deeper into specific case studies to reflect on insights relevant to their local communities.
Neighborhoods in North and West Long Beach have experienced dangerous amounts of pollution for decades, earning them the distinct moniker of the “Diesel Death Zone.” This zone contains the Port of Long Beach and the Port of Los Angeles, the two largest container ports in the country, five oil refineries, nine rail yards, four major freeways, several chemical facilities, and the third-largest oilfield in the contiguous United States. On average, the Port of Long Beach and the Port of Los Angeles produce 100 tons of smog per day, which is more than the daily emissions from all six million cars in Los Angeles County combined.
The culmination of these pollutants have contributed to an increased risk of health consequences for residents in North and West Long Beach. “Almost every family I know has someone suffering from asthma, respiratory health problems, lung disease, or cancer,” one West Long Beach resident said. These structures, and their local economies, have directly contributed to hazardous air and water pollution, which has disproportionately impacted communities of color in Long Beach.
One common approach to mitigating pollution is carbon capture through a city’s urban tree canopy. With this approach and the Long Beach Climate Action Plan in mind, the City applied to the TOPC sprint with the following question: how might the City of Long Beach increase urban forest cover and reduce health inequities, especially in the areas of Long Beach which have historically lacked tree canopy and have been disproportionately impacted by local pollutants?
The sprint team included staff from the City of Long Beach, Puente Latino, the Nehyam Neighborhood Association, and a pro bono technical team from Google.org. The City team featured a cross-departmental group consisting of public servants from the Office of Sustainability and the Technology and Innovation Department.
Murriel Perez McCabe Pro Bono Engineer, Google.org"As a Long Beach resident I was drawn to the opportunity to work with my local community. This project allowed me to engage with different groups to understand the varied needs and priorities within the community, and connect with individuals committed to building positive outcomes for the city."
Puente Latino and the Nehyman Neighborhood Association acted as the community partners in the sprint, providing knowledge of urban greening efforts and resident needs while also leading events to gather resident feedback. With an eye toward more equitably including underrepresented community perspectives in the program, CPI experimented with two community partners on the Long Beach team this year.
To better understand this problem, the sprint team developed an inventory of data systems related to urban greening; a mutually beneficial relationship between city residents and the environment. This inventory included databases from the Long Beach Public Works Department, the Office of Sustainability, and statewide resources such as the California Communities Environmental Health Screening Tool. The sprint team also created a systems map to better visualize the wide range of Long Beach actors working on urban greening. Finally, the Sprint team interviewed 28 residents to learn how a lack of tree canopy affects their daily lives. The research process produced these top insights:
Residents desire increased data transparency around urban greening in Long Beach to more deeply understand tree canopy inequities and health benefits.
Local government stakeholders and community members both voiced their interest in easily accessible public tree data. Staff at the City of Long Beach thought it would be beneficial to have “a more integrated approach for information about trees in Long Beach and that trees should be benchmarked regularly.” Benchmarking—or examining tree health data and creating an integrated approach to tree information—they hoped would highlight areas in Long Beach to prioritize for tree care and maintenance. From the community’s perspective, the increased transparency around the city’s trees would help them make a case for more equitable green space.
A recurring theme was the importance of community education focused on how trees can mitigate air pollution. “Many people don’t know about the problems. [They] don’t know their kids could have lung problems,” one resident said. Another resident, highlighting the high amount of pollution, said, “We have many areas of contamination. There are refineries nearby, a trash center near Cherry [Street], the 710 and 91 highways, and there are constantly heavy trucks coming to/from the port. We are a part of Long Beach that is heavily affected by contaminants, such as diesel, which is dangerous for health (asthma, premature births).”
Throughout the local government and community feedback, there was also consistent demand for more data on urban greening and the educational value of making this data widely available. “We need more data from the City on vacant lots - what will they be used for? Could residents have input on how they will be used? Could they be green spaces?” one resident asked. Another resident mentioned, “We need more trees and parks. We have empty terrains and they shouldn’t only be used for homes. We need more green areas.”
Residents believe increased information and communication will encourage community participation in urban greening.
In addition to publicizing tree data, residents believed that this information should be shared in a culturally humble manner and that the communication should facilitate and uphold community-driven urban greening efforts. “People feel like they are not being heard. We should set up avenues of communication with the people we are trying to serve,” one resident said. Regarding community outreach and communication, one resident similarly remarked, “Engagement plans currently attract the same demographic. White residents and wealthy communities.”
Despite the lack of communication, residents shared their interest in volunteering their time to support urban greening initiatives. “If there was another group that started doing urban greening or environmental work, I would help. I like the activities associated with these groups; I get to meet other neighbors and help with tree planting,” one resident said.
Finally, residents highlighted that culturally competent information and communication will lead to urban greening efforts that strengthen community relationships. “The community is estranged. We don’t have social connection to neighbors, or at the very least not strong community connections. We should increase Long Beach community solidarity,” one resident said. Urban greening will help mitigate environmental health concerns, but will also strengthen the social fabric of Long Beach community residents.
After reviewing the research insights and ranking potential products by their potential impact, the sprint team ultimately decided to develop a Long Beach Tree Map. Using tree data from the Office of Sustainability, Housing and Neighborhood Services, and the Conservation Corps, the Tree Map visualizes the City’s tree inventory, educates community members on urban greening initiatives, provides the public with access to data regarding trees in their neighborhoods, and serves as a culturally competent platform for information on tree care initiatives.
This virtual Tree Map visualizes the urban tree canopy in different Long Beach neighborhoods, highlighting disparities in urban greenery and demonstrating which neighborhoods should be prioritized for tree planting. In addition to prioritizing neighborhoods, the map also identifies recently planted trees, which are at the highest risk of dying prematurely. This distinction was identified during the problem understanding phase and helped the sprint team narrow the problem scope.
The Tree Map also illustrates the environmental benefits of an urban tree canopy by demonstrating how many tons of pollution are removed by the city’s tree canopy and translating that to dollars. The team was proud to include this statistic because it highlights to the public how much value trees bring to the community, particularly to the communities most affected by nearby pollutants. At the micro-level, the Tree Map provides key information on individual trees. This data includes the tree’s species, its common name, its street address, its neighborhood, who it was funded by, who it was planted by, and its grow space. Users are also able to report an issue with a specific tree.
In addition to the main Tree Map feature, the tool addresses key challenges that surfaced through community research: the need for greater community engagement and education. To address engagement, the team decided that a Long Beach Tree Calendar would provide community members the platform to submit public events and, simultaneously, for community members to volunteer at those events, such as a tree planting event. To elevate community education within the tool, the team created a resources page to provide more information on tree maintenance, such as how to plant and water a tree.
As the team developed the product prototypes, they tested the tool with community members and it was positively received. “This tool will help residents to better educate themselves and potentially engage in positively enhancing their neighborhoods/city and in turn their livelihoods through this urban forest initiative,” one community member said. The community shared their excitement around the tool and also contributed ideas for additional Tree Map functions. For example, the team incorporated community feedback by identifying recently planted trees on the Tree Map by a different color to easily distinguish them from older trees.
The City of Long Beach launched the Long Beach Tree Map on November 15, 2022. Although it is not fully open-source, the code will be easy to replicate in partnership with the Long Beach team.
As the sprint team aims to increase the tool’s usage, they hope to identify neighborhood tree stewards who would be responsible for organizing tree maintenance in their specific areas. These tree stewards would play a critical role in improving Tree Map information and strengthening community engagement by reporting trees for maintenance and creating public tree care events. Although the tool will be accessible to everyone, these community members will be key to the tool’s success.
The sprint team is also prioritizing equitable access to the tool by expanding its current language offerings from English and Spanish to Tagalog, Khmer, and Vietnamese. Additionally, the community partners involved in this work hope to teach other local community agencies about how to utilize the tool.
Long Beach’s community partners—Puente Latino and the Neyham Neighborhood Association—plan on staying heavily involved in the tool’s maintenance and promotion to residents. In particular, as new tool functions or attributes change, they hope to host user-testing sessions to match the tool’s characteristics to the residents’ needs and preferences.

Since 2015, the City of Detroit has been one of the country’s worst digitally connected cities. 63 percent of low-income homes in the city have no in-home internet broadband, while 38 percent of homes have no internet connection at all. Quality, reliable internet access is often necessary for completing school work, going to a virtual doctor’s visit, connecting with loved ones, and earning a living. However, in Detroit, as in many cities across the U.S., internet access and use are often inequitable and unreliable, preventing many from living healthy, fulfilling lives.
Residents in lower-income neighborhoods and communities of color are often denied quality internet service, experiencing frequent and prolonged outages, high cost for services, or simply not receiving internet at all. Detroit’s Office of Digital Equity aims to increase internet access to advance citywide digital equity. However, information on which neighborhoods are most adversely affected by poor internet access doesn’t always permeate through the City ecosystem, and residents lack visibility into internet quality across the city.
With this in mind, the City set out to discover: How might we collect internet performance data (e.g., outages, speed, cost, provider) from residents in the easiest way and display that data so residents have more transparency around provider performance?
The sprint team included staff from the City of Detroit, Hope Village Revitalization (HVR), and a pro bono technical team from Google.org. The City team featured public servants from across the Department of Innovation and Technology, including the Office of Digital Equity and Open Data team.
HVR acted as the community partner in the sprint, providing knowledge of residents’ experiences with internet outages and making connections with residents to gather their feedback.
The City of Detroit aims to increase internet access to advance citywide digital equity by running fiber optic cable in an open-access capacity to every Detroit household by 2032, prioritizing neighborhoods with historic and ongoing digital inequity. Digital equity is a condition in which all individuals and communities have the information technology capacity needed for full participation in our society, democracy, and economy. Digital equity is necessary for civic and cultural participation, employment, lifelong learning, and access to essential services. The City began its efforts with a pilot in the Hope Village neighborhood, which became a priority for the infrastructure investment when residents alerted the city that their ~2,500 households experienced a 45-day internet outage in the middle of the COVID-19 pandemic.
The City first became aware of this outage due to the actions of HVR, who were essential to the city’s awareness and understanding of digital inequity. Initially, the City framed the project around empowering residents to have greater insight and decision-making power in the fiber optic rollout. However, when discussing their problem frame with HVR, the city learned that the fiber optic rollout, while important to solving residents' ongoing internet connectivity issues long-term, was not the most immediate or pressing challenge facing residents. Addressing the ongoing internet outages was much more important to improving residents’ quality of life and trust in the city. With this in mind, the sprint team began community research into residents’ experiences with outages.
Justin Nowell Pro Bono Product Manager, Google.org"This product should do a lot to increase the transparency of Internet outage data, and should significantly improve the ability of Detroit residents to better understand the quality of internet connectivity throughout the city."
In the community research phase of the project, the team surveyed 25 residents and interviewed nine residents to learn how internet outages impact the well-being and daily lives of Hope Village residents. The team also conducted secondary research on existing outage/service reporting platforms and the FCC’s process and requirements for providing internet service to better understand the needs and features a potential solution might need to include.
Ultimately, the research revealed these top insights:
Residents of all levels of technical capacity need a standardized process to report outages that is reliable, accessible, and available despite lack of connectivity, so that they can get information and resolution from the City or provider.
When asking residents about their experience with reporting outages, the sprint team discovered that the process was often difficult, time-consuming, and inaccessible. Internet service providers did not provide an easy, standardized way for residents to report outages. Some residents would call their providers and be “on the phone for three or four hours to report an outage” or “spend 50 percent of [their] time holding and listening to an automated voice.” Others would text their provider or DM their provider on Twitter, while some went straight to the FCC, often with mixed results. With no clear process and little communication, residents were left confused and feeling like they had nowhere to turn to get the service they deserved. Furthermore, the fact that the burden to report, solve, and navigate around outages fall solely on them created inequities. Some residents, especially seniors, found different reporting systems difficult to navigate, while other reporting systems required internet access - which made them impossible to use in an outage. “I just wish there was a better way to handle communication between the company and the residents they’re supposed to be serving,” one resident said.
Residents impacted by outages want to see data related to the status of their outages (where, how long it's been going on, expected resolution time and date, and cause) as well as the status of all outages so that they can make appropriate plans and choose the best internet service provider.
Once an outage occurred, residents were often left in the dark about the status of their outage and were unable to decide how they should proceed, leading to distrust and frustration. Residents were left with questions: How long should they expect the outage to last? Where was the outage occurring? What caused it? Was their particular outage part of a larger-scale problem with the provider or City? Having this information would allow residents to better plan for how to handle the outage—whether through making complaints to the FCC, changing providers, finding a short-term solution, or simply alerting their loved ones that they may be disconnected for a time. The lack of transparency also led to distrust between residents and their service providers. “I don’t feel we should be the ones that have to pick up the phones and find out what happened. Respect us and let us know,” one resident said.
Based on what they learned through their research, the sprint team set out to design a platform that could automatically and universally crowdsource data on internet outages and provider performance and publish it for residents. Currently, data on internet performance is held by internet service providers and is closed to the public, making it near impossible for residents to evaluate their provider performance or advocate for the service they deserve.
To collect the data, the team proposed a hardware solution that would involve the use of raspberry pi devices—a single-board computer made by the Raspberry Pi Foundation, a UK charity that aims to educate people in computing and create easier access to computing education. The City planned to distribute raspberry pi devices to community members to collect, share, and publish data on internet performance. However, the hardware solution required a much longer time horizon than the sprint, and residents were experiencing outages now.
In order to quickly get residents' support they could benefit from, the team decided to build a self-reporting internet performance survey that they could complete when they’re experiencing an outage. The survey would publish the data for public access and provide guidance on residents' actions to address their ongoing outage. The City tested the tool with five residents and made some edits to the survey to make the language more accessible and address residents’ concerns with identifiable data. Lastly, the user tests helped the city prioritize what features they may want to pursue with further development, like automatic FCC filings and including data on historical outages. The team plans to continue user-testing with community residents to receive more feedback.
The City plans to launch the survey and visualization in early 2023. This will continue to collect data from residents and serve as an advocacy and information tool while the City works to set up and scale a longer-term hardware solution.
In the meantime, the City will partner with the University of Chicago’s Internet Equity Initiative to gain access to a handful of raspberry pi devices and an open-source code and data platform. They plan to use these devices to pilot the hardware solution by June 2023, then scale up from there.

Miami-Dade County is booming. More people are enjoying the beaches and soaking up the Florida sun, and businesses and entrepreneurs are relocating or establishing their companies within the county’s perimeter. While the largest businesses have the resources to navigate the licensing process, it can cause significant headaches for small and micro-businesses. For context, more than 80 percent of Miami-Dade County’s businesses have nine or fewer employees, and more than 96 percent have 49 or fewer employees. Further complicating the licensing process, the county is home to 34 municipalities, with the process varying from city to city. Beyond the complexities that come about from multiple municipalities, different types of businesses need unique licenses. For example, a brick-and-mortar salon will require a different set of licenses than an online, home-based clothing store. Miami-Dade County also has a rich history of immigration and is home to many residents whose primary language is not English. Among the residents starting new businesses in 2019, 74 percent were immigrants. Furthermore, 76 percent of residents speak a language other than English at home To support residents looking to start businesses, Miami-Dade County is prioritizing removing the barriers for these businesses in the licensing process.
Recognizing that many business owners would struggle to navigate these processes, Miami-Dade County set out to answer the question: How can we improve the business licensing process so that small business owners know which licenses are needed and how to secure them?
The sprint team included Miami-Dade County, Urban Impact Lab, and a pro bono technical team from Google.org. The cross-departmental team from Miami-Dade County included staff from the Mayor’s Office, Regulatory and Economic Resources (RER), Communications and Community Engagement (CCED), and Information Technology (ITD). The knowledge and experience shared across departments provided a strong foundation for understanding the nuances of business licensing and integrating a new digital tool into the County’s current infrastructure.
Esteban Obando Pro Bono Product Manager, Google.org"I recently moved to Miami and this was a great opportunity to engage with the community. I learned so much about how the county operates and how, with technology, we can help provide solutions to residents and entrepreneurs."
The community partner, Urban Impact Lab, already had relationships throughout the small business ecosystem through their program Axis Helps, and brought expertise in human-centered design and research, serving as the liaison to entrepreneurs and leading the community research process.
Rather than develop a solution from preconceived notions of the problem, the team explored the relevant data and talked with entrepreneurs and business owners to understand the barriers to permitting through the lens of the people encountering them. The team began by identifying existing data on certificates of use (CUs) and a business tax map from their online open data portal; they also had access to internal data on CUs in progress from the Department of Regulatory & Economic Resources.
In addition to analyzing existing data sources on licensing, the sprint team met with local entrepreneurs and business owners to hear about their experiences obtaining licenses for operation. During these sessions, the team explored a few questions: What challenges were entrepreneurs facing? How could business permitting be easier? What was the government’s role in creating and solving these challenges? Throughout this process of community research, the sprint team interviewed 18 business owners and conducted surveys with 17 more. The team also worked to speak with residents who primarily speak other languages to understand better the challenges they face with business licensing. In addition to talking with business owners, the team interviewed three business service providers with a long history of supporting new and growing businesses in the area. With extensive relationships throughout the local business ecosystem, Urban Impact Lab was key in setting up and conducting these information-gathering sessions. While some hypotheses were confirmed, the research process produced the following top insights:
Business owners do not know where to find the information they need about business licenses. When starting businesses, residents will search far and wide to locate the information they need; friends, accountants, lawyers, websites, and business service providers are just a few of the people and places that entrepreneurs rely on to obtain the information they needed. Was the information they received correct? Sometimes, yes. Sometimes, no. The lack of a central source of truth that could point current and future business owners to the latest, most accurate information was either non-existent or difficult to find.
Entrepreneurs are confused by the different types of licenses needed at the state, county, and municipal levels. New businesses need to register with the State of Florida, then secure local permits. Which permits do they need, and from which level —the County or municipality? These were the types of questions that entrepreneurs were asking before being able to turn on the lights at their stores. A business in one municipality might need a different set of licenses in another, which also might require a different process for securing the license. In some cases, business owners needed to go to the County first; in other cases, the municipality was first. Alexina Prather, director of Axis Helps at Urban Impact Lab, summed up the research this way: “The most common theme expressed in our conversations with the small business community, was the lack of information available on what's required for small businesses to operate in regards to permits, licenses, and other crucial documentation. The small business owners we spoke with expressed the difficulties they faced due to information gaps of what's required at the City level, the County level, and also what is needed for different types of businesses.”
After identifying the barriers to securing business licenses, the sprint team brainstormed potential solutions that would provide both a central place for information in multiple languages and the steps to secure County and municipal licenses. One idea was a series of YouTube videos explaining the process of securing permits; another was integrating the County’s permitting website with Sunbiz, the state of Florida’s business registration site. Ultimately, the sprint team decided to build a user-friendly Business Assistance Guide to collect information such as location, type of business, and business structure. In response to this information, the Guide would outline the processes needed to secure the necessary licenses. While the County had an existing tool that would meet many of these requirements, it was outdated and difficult for users to navigate. In addition to the information the current tool was supposed to provide, the new tool would send an email outlining the process and needed licenses so that business owners could track the progress of securing necessary licenses. Furthermore, the tool would provide links to the municipality where the business would operate so that the business owner could obtain licensing information from the unique municipality.
The pro-bono technical team from Google.org and the Miami-Dade County Information Technology Department (ITD) worked together on product development. After exploring various platforms and open-source options for developing the Guide, the team aligned on using the County’s GIS application, ArcGIS Survey 123. While not open-source, this system aligned with the county’s technology requirements and offered long-term sustainability for the County with low-touch maintenance that can be performed by the business unit that oversees business licensing. Additionally, due to policy changes and emerging business categories, the tool will be updated periodically to provide residents with the latest, most accurate information. Throughout the development, Urban Impact Lab ensured that residents’ feedback from the research period informed the tool's design, ensuring the tool was accessible and pushing for user-friendly features. For example, the tool will be available in English, Haitian Creole, and Spanish, to ensure that a significant portion of Miami-Dade County residents can easily access any information they will need to open and operate a business. “The tool is a form of transparency,” shared Cheriene Floyd, director of performance and analytics at Miami-Dade County. “It is putting the information out there (by business type). This way entrepreneurs know what they need to do before they invest time and money into opening their business.”
Before Google.org’s support concluded, they worked to embed GIS data into the tool that would provide municipal overlays to the tool. Users will be able to enter an address and immediately know which municipalities to work with to secure essential licenses. The sprint team did not test the tool with residents during the TOPC sprint but has plans to test with small business owners in the first quarter of 2023 and make updates based on their feedback.
As the County is replacing a functioning tool, the Business Assistance Guide has to meet or exceed its current capacity. Therefore, the minimum viable product (MVP) did not launch publicly in 2022. The County has laid out a plan to officially launch a completed tool in late 2023 that will allow them to sunset the current tool. In order to move the Business Assistance Guide from its MVP-form to a completed tool, the Miami-Dade County team will document and create unique workflows for the licensing requirements for numerous industries and municipalities.
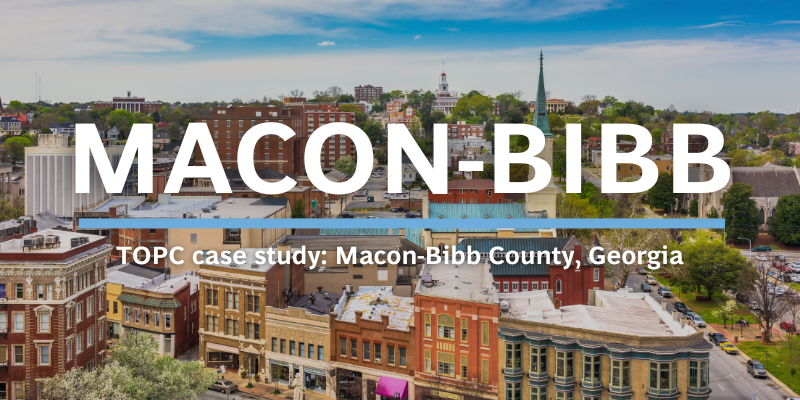
In Macon-Bibb County, there are approximately 6,000 blighted properties. At a high level, a property is considered blighted if it is “uninhabitable, unsafe, or abandoned.” Blight is particularly prevalent in the historic Pleasant Hill neighborhood. According to the Middle Georgia Regional Commission, there are 95 blighted properties, a vacancy rate of 26.2 percent, and an average home value of less than $50,000 in Pleasant Hill. Blight not only leaves an aesthetic scar on neighborhoods, but it can also contribute to the devaluation of properties, public safety concerns, and negatively affect the mental and physical health of residents.
Removing blight was identified as a major priority for Pleasant Hill and Macon-Bibb County starting in April 2021 after the County conducted a broad-reaching community listening series. When the sprint started, Macon-Bibb was nearing the demolition of 200 blighted structures countywide, but more work needed to be done, particularly within Pleasant Hill. Therefore, the Macon-Bibb sprint team partnered with residents and examined public data to explore the following question: How might Macon-Bibb partner with residents to reduce blight in the Pleasant Hill neighborhood and support broader community revitalization?
The sprint team included staff from Macon-Bibb County, the Macon-Bibb County Community Enhancement Authority (MBCCEA), and a pro bono technical team from Google.org. The County team featured a cross-departmental group consisting of public servants from the Information Technology and Communications Departments, and advising from the Office of the County Manager and the Department of Codes Enforcement.
Jeneuse Geula Pro Bono Product Manager, Google.org"By gathering feedback from residents early and often, we were able to design and create a useful tool, while addressing resident concerns on privacy, transparency, and responsiveness. This was a unique experience to truly co-create with the community-partners and residents."
The MBCCEA acted as the community partner in the sprint, providing critical expertise on the Pleasant Hill Neighborhood and resident needs and hosting events to gather resident feedback. They also offered educational events for residents to learn how to use the tool that was developed during the sprint.
To better understand how blight affects Pleasant Hill residents, the team analyzed government and community blight data and engaged in robust community feedback. The team examined data from more than ten county offices, ranging from Codes Enforcement to the Tax Assessor’s office. On the community outreach side, the team engaged with more than 120 residents via three community listening sessions, a blight town hall, and a survey. During the community meetings, the team learned about how blight harmed residents’ mental and physical health, decreased community pride, led to higher incidences of criminal activity and illegal dumping, and reduced property values, impacting individual and communal wealth.
These community conversations were complemented by an online survey which received 43 responses. The survey shared feedback on how blight impacted residents, their perception of the county’s actions to address blight, and how they would like to see blight mitigated in their community through the TOPC program. This robust data analysis and community research process produced the following top insights:
Residents want greater clarity, transparency, and accountability with the County’s blight remediation process. Residents reported confusion and a lack of awareness of the County’s efforts to address blight outside of using demolitions. Residents wanted to know what property conditions were considered blight; what actions the county was taking to address blight reports; what general data existed on blighted properties in their community; and how to individually take action to address blight, including opportunities to purchase blighted properties. However, residents found it difficult to learn what actions Macon-Bibb County was taking to address blight reports, which contributed to a perception that the County was not being responsive to blight in their neighborhood. During one of the community sessions residents asked: “Why are things always left undone?” and “Why are other neighborhoods better taken care of by the County?”
Residents shared a desire to save and rehabilitate properties rather than demolish them. A major tool within the county’s campaign to eradicate blight has been demolitions to remove unsafe properties. While effective, residents were concerned about the psychological impacts of demolition. Buildings that were torn down were often the homes of friends and families. Tearing down these blighted buildings often felt like a form of erasing memories and relationships. The team surveyed 43 residents, and 83 percent of respondents stated they would prefer blighted properties be repurposed (e.g., new/restored buildings) rather than demolished. Demolitions also left vacant lots, which were not maintained and left eyesores in their community. “We need a plan to clean out lots after demolitions. Right now, there is only the demolition without any plan of what to do after the walls fall,” one resident said.
Resident insights made it clear that they wanted a tool that would make it easier for them to report blight, track government actions to address blight reports, and keep them informed so they could take their own actions to address blight. The team produced the Blight Reporting Tool, an open-source tool that meets these needs by enabling residents to:
Report and upload photos of blighted properties;
Research blighted properties in their community, including the ability to view a map of blighted properties and learn information about specific properties;
Track the status of blighted properties from start to finish, including the option to receive County notifications regarding actions taken to address specific properties.
Kai Fan Web Developer, Macon Bibb County"After the research and talking with the community and our partners, we realized that it's not just checking the process from the public's perspective, but that they needed a tool to not only help them track the project, but also have more official information to help them improve and invest in the community in the future. We are trying to shape our product to provide as much as possible to the public.”
The team tested the tool with community members and Codes Enforcement staff, who received it positively. Residents shared that it was important to them to know that their reports were seen and being acted on; they felt that this tool would help increase County accountability in responding to blight reports. Based on their feedback, the team added in a phone number and email address so residents could reach out to a Codes Enforcement staff member with questions. In addition, residents shared that community education on how to use the tool would be critical, given that many residents were seniors.
The Blight Reporting Tool officially launched in November 2022 and is being rolled out to the community. In addition to launching the tool, the County is partnering with MBCCEA to offer in-person educational sessions on how to use it.
Future development plans include adding in a report tracking number based on resident feedback, integrating the tool with the current technology used by Code Enforcement, an educational video about blight prevention and remediation, the creation of a blight hotline for residents who do not have technological access, and the development of an internal dashboard that uses GIS technology to map blight. In particular, the Codes Enforcement staff are excited about the tool's potential to make the blight remediation process more transparent and make it easier for residents to learn about the status of a blighted property. They see this as an opportunity to improve their own internal reporting and produce dashboards.
Pending tool performance, the County hopes to scale the tool beyond Pleasant Hill so that every neighborhood in Macon-Bibb County can use this tool to address blight in their community. They also hope to adapt the tool so that Codes Enforcement can use it to transparently share data and information about other services that fall within their purview.
During the sprint, a few key lessons surfaced that may be helpful for local governments seeking to apply best practices from the TOPC approach:
Human-centered design: Understanding a problem takes time but builds foundational relationships and understanding that are essential for co-creation.
The problem-understanding phase requires teams to slow down to understand the problem in the local community context. This phase can be uncomfortable for team members, who often want to take action immediately to solve the problem. In addition, the design process requires teams to bring in stakeholders most affected by the problem, which takes time—the team needs to identify these community members and engage them in meaningful discussion to understand their relevant knowledge. Once this phase is complete and relevant stakeholders have been engaged, however, a deeper understanding of the problem and the community’s buy-in enables the team to work with direction and conviction. With a clear problem statement, the team can confidently develop and test a product with future users. This process may start slowly, but it creates foundational relationships that ensure that the product continues to meet residents’ needs and enable community and government co-creation beyond the sprint.
Community engagement: Co-designing tools requires a mindset shift to thinking of residents as the primary users of the digital tool.
The TOPC sprint instills a community engagement mindset by embedding resident and community voices in the sprint team. Sprint teams ask for resident feedback at several points in the sprint, including while researching the problem and testing the digital product. More critically, TOPC requires teams to have community organization members sit on their team to better embed the community’s perspective in the team's day-to-day operations. While one community partner isn’t a perfect representation of all community perspectives, these individuals provide a vital link to the community and help to consistently center residents' needs. However, since government employees often build and maintain the digital tools, it can be challenging to shift to a mindset with the resident as the end user, rather than a government department or employee. “We look at those [government] departments as our end user, but they're not the ultimate end user. The ultimate user is the public because they're the ones that have to get the information to get to the department that they need or the information from the department that they need,” said Barbara Marlin, GIS manager for Macon-Bibb County. One of the most complex parts of sharing power with residents is not just getting feedback at one point in the process but building feedback into each step.
Data and transparency: Sharing data builds reciprocal relationships, empowering residents to engage in government processes and enabling governments to earn trust through transparency.
Making data more available is a form of transparency, lowering the barrier for accessing information that residents need. For example, Long Beach residents will be able to access a map of urban trees and monitor the progress to increase urban green space for residents. “Making data available to the public helps in gaining trust from the community. The more governments share and the more they are open helps communities gain a better insight into how things truly are,” said Vanessa Covington, Long Beach’s California Climate Action Corps fellow. Open data also offers clarity on areas of concern and demystifies actions being taken to address ongoing challenges.
In Macon-Bibb, the County is focused on giving residents the information to take action. “I believe blight is a public issue, and I feel it does take two sides to work. As a government entity, we of course have to play our role, define the property, take action. But as for the public, I believe they can monitor and supervise the government with a more transparent process and they also have a chance to engage,” said Kai Fan, a web developer for Macon-Bibb County. Ultimately, open data can lower the barriers to civic participation, as residents have the information to advocate and the relationships needed to engage meaningfully.
Cross-sector collaboration: Working across sectors mobilizes the systems, relationships, and resources needed to address complex problems.
With a local government, community partner, and pro-bono technical support from Google.org, TOPC acknowledges the complexity of community problems by convening at least three unique perspectives to understand and address them. Local governments may have resources and a desire to solve a problem, but need support from other experts. The community partner(s), meanwhile, bring unique knowledge about the problem topic, and they often have relationships with affected communities and other organizations with relevant expertise. In the case of Long Beach, the City worked with Puente Latino—a North Long Beach organization supporting cultural events, art programs, and community beautification projects—and the Nehyam Neighborhood Association, an organization focused on ensuring a high quality of life in the Nehyam neighborhood. Vanessa Covington, when reflecting on Long Beach’s community partners, shared that “both community partners offered a different perspective and this tool is a great example to show how we all share a common goal in the end. We all can offer something different and that is always needed.”
Similarly, the pro-bono technical team from Google.org provided unique skills, like user-experience design and open-source software development, to build the Tree Map. This ultimately supported the community partners’ efforts by educating the community on local initiatives, providing data on local trees, and creating opportunities to get involved in tree care initiatives. This inclusive approach created a more comprehensive tool than any one partner could have imagined or delivered.
Equity: Publishing open data highlights inequities, enabling government and resident advocacy for communities facing systemic barriers.
While conducting community research, the Detroit sprint team found that many residents faced unusual internet outages. By collecting and publishing internet performance data, Detroit is increasing residents’ agency to select a reliable provider while also making providers more accountable for reliable, affordable, and speedy internet. With isolated complaints, residents’ voices may be overlooked, but publicly sharing internet service data will leave no doubt about the extent of the problem. Over time, this data will hopefully lead to providers increasing their commitment to the community by ensuring equitable access to high-speed internet for all residents in Detroit
The second TOPC sprint provided the participating cities and counties with many opportunities to learn best practices around data governance, community engagement, and human-centered design.
As we reflect on the successes of this sprint, we also recognize that there are ways to improve the experience for our participants by modifying components of the program’s design and structure. The following subsection provides a brief analysis of some of the highlights and opportunities to iterate upon moving forward:
Visualizing systems to improve relationship building and identifying who should be involved in the design sprint:
This year’s sprint included a new learning session in the onboarding phase of the program, which led the four teams through the creation of a systems map—a visual depiction of a system, including its relationships, feedback loops, and actors. By visualizing the complex and interconnected nature of a system, the teams actively questioned who is (or is not) involved with their selected problem and how they can dismantle potential power imbalances throughout the design sprint. Ultimately, this activity trains teams to analyze inequitable power dynamics, identify underrepresented actors who are directly affected by their chosen problem, and sets them up to better engage these actors during the sprint.
During the learning session, the city and county teams identified the different government departments, community residents, community organizations, and datasets relevant to their original problem statement. Once teams identified all of these actors, they made connections to represent relationships within their local system. After teams completed their systems map, they walked away with a stronger understanding of who is involved in their selected problem area, and just as importantly, who is not involved but should be brought into the fold. With regards to data, the datasets located on the team systems maps encouraged the teams to consider what datasets could benefit from public access or increased transparency.
One growth area for next year is inviting community partners to this learning session. Since community partners had not been onboarded to the program yet, the session was held solely with participants from the city and county government staff. Community partners can provide greater insight into other actors and their relationship to the problem and the system, making the map a stronger resource for the sprint team. This is also an opportunity to more equitably include community partners as co-owners of the process with their government teammates.
Hosting in-person design workshops and building trust among sprint teammates:
For the first time in TOPC programmatic history, two key workshops were held in person for one of the teams: Long Beach. As part of the community research phase, the Long Beach team met at a local community farm for the Data Synthesis workshop and the Ideation & Prioritization workshop. The Data Synthesis workshop focused on reviewing insights from resident interviews and developing themes to easily categorize the insights. The Ideation & Prioritization workshop brought the team together to brainstorm a variety of potential solutions to their problem area, map the proposed solutions based on their feasibility and impact, and eventually select one solution to begin working on during the product development phase.
Reflecting on the in-person meeting, Long Beach teammates thought it was “super valuable” and that the meeting “made [them] feel more comfortable with each other.” The in-person meeting strengthened relationships between teammates and assisted with the team’s ability to arrive at decisions and foster a sense of belonging within the team.
As we look toward the next sprint, we will explore when and how often sprint teams can convene within their locality and with sprint teams across the cohort in person to maximize the benefits mentioned above.
Reconfiguring the sprint timeline and ideas on future adaptations:
This year we adapted the sprint timeline in several ways. At the beginning of the program we included more time in the onboarding phase. This was a growth area we recognized after TOPC 2021. With this in mind, we included extra time for early-stage team building, team onboarding, and problem scoping. This additional time at the beginning of the program provided sprint teams with more time to understand the program’s structure and to build relationships with their partners.
Toward the end of the program, we created a completely new offboarding phase to provide teams a buffer time between Demo Day and the program’s conclusion to finalize changes on the product’s design, transfer product documents to the city/county teams, and to align on how to sustain the product in the long-term. Not every team was able to meet the Demo Day launch deadline, so we inserted some grace into the program by removing the strict product launch deadline and adding two extra weeks to the end of the program to work on product launch. Although this created some variability with sprint team launch schedules, we hope this flexibility in the program allows teams to launch once they are confident in the product they are launching and all tangential questions are resolved.
Coaching toward co-ownership:
The implementation of a novel offboarding period was paired with guidance on how to approach product co-ownership and sustainability. One specific area for growth regarding product ownership is providing additional guidance on what co-ownership looks like in TOPC. What does it look like for a community partner and local government to co-own an open-data digital product? One sprint participant shared their wish for “clarity on the concept of ownership” and shared that they were “a bit confused as to whether they are supposed to have co-ownership over the process or co-ownership over the end product.” Clearly, there is room to improve coaching and guidance around how teams can share power between government and their community partners.
During our TOPC Demo Day on November 15, 2022, we had the great privilege of having Raylene Yung, executive director of the Technology Modernization Fund and co-founder and founding CEO of U.S. Digital Response as our keynote speaker. Raylene shared the following remarks with our webinar participants:
“I really believe that all the technology we need to effectively deliver public services already exists today. The problem is not an invention of new technology. What matters most to us now is how we choose to use technology, what are the problems we are choosing to work on, who are the people we choose to work with and work for, and who are those end-users we are trying to build a better life for.”

Raylene’s remarks summarize one of the key tenets of the TOPC program: for technology to be effective, it must center community members, and it must center relationship-building. To meet the material needs of residents through open-data technological initiatives, public servants must endeavor to strengthen their relationships with community members.
With this in mind, the TOPC sprint built relationships between communities and their governments, and elevated residents as co-designers in this process. This mindset shift and team commitment created a space that valued lived experience just as much as technology or design backgrounds. Ultimately, appreciating residents’ lived experiences as knowledge and expertise led to products that directly responded to the needs of community members.
With the goal of improved relationships through human-centered technological innovation and the ability of open data efforts to drive civic participation, we are excited to see the continued development of our four city and county products. As we look toward the third iteration of the TOPC launching Spring 2023, we hope to learn from last year’s lessons and eagerly await to see the positive impact of the digital products created during this sprint.
This work was made possible with the support of dozens of people who are all passionate about the power of open-data technology, civic innovation, and cross-sector collaboration. The Centre for Public Impact and Beeck Center for Social Impact + Innovation at Georgetown University are grateful for all the energy, insight, and care that our TOPC participants brought to this work. TOPC would not have been possible without the participation and support of the following individuals:
City Government - Joshua Edmonds, Autumn Evans, Art Thompson, Oscar Chapa, Martin A. Denicolo, Jacob Yesh-Brochstein, Steven Wiltse, Kevin Zhang
Community Partner: Hope Village - Debbie Fisher, Stephanie Johnson-Cobb, Dell Stubblefield
Google.org - Gyam Simon, Tara Kelber, Sonal Somaiya, Justin Nowell, Michelle Lee, Malika Chatlapalli, Elizabeth Fregoso, Joshua Marsh, Gerardo Rebollar, Glenn Durfee, Jess Huang, Joseph Arias, Mollie Bates, Tiffany Yang
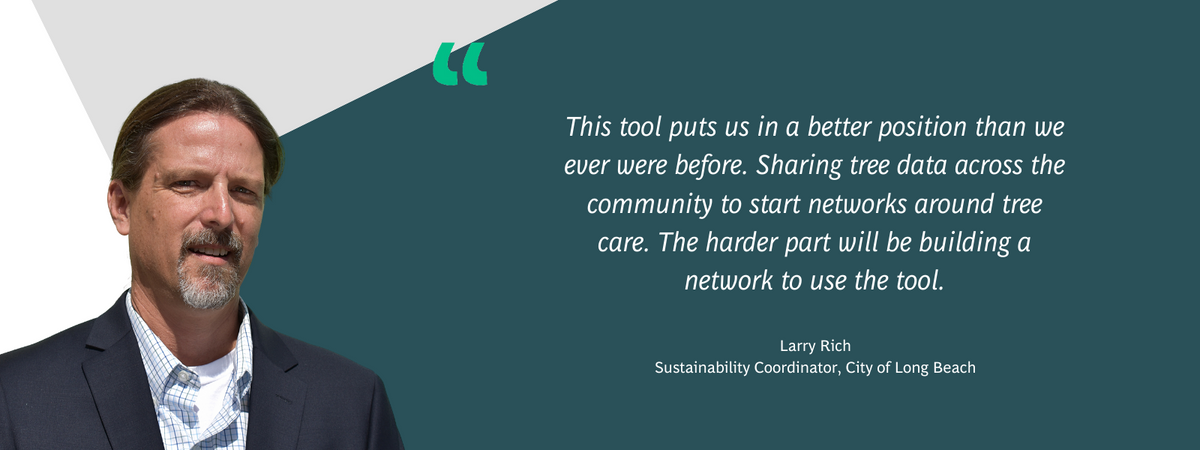
City Government - Lea Eriksen, Nishchal Chaudhary, Larry Rich, Joy Contreras, Vanessa Covington, Thomas Nguyen, Anna Liu, Diya Baliga, Yuxin Zheng, Joyce Mok
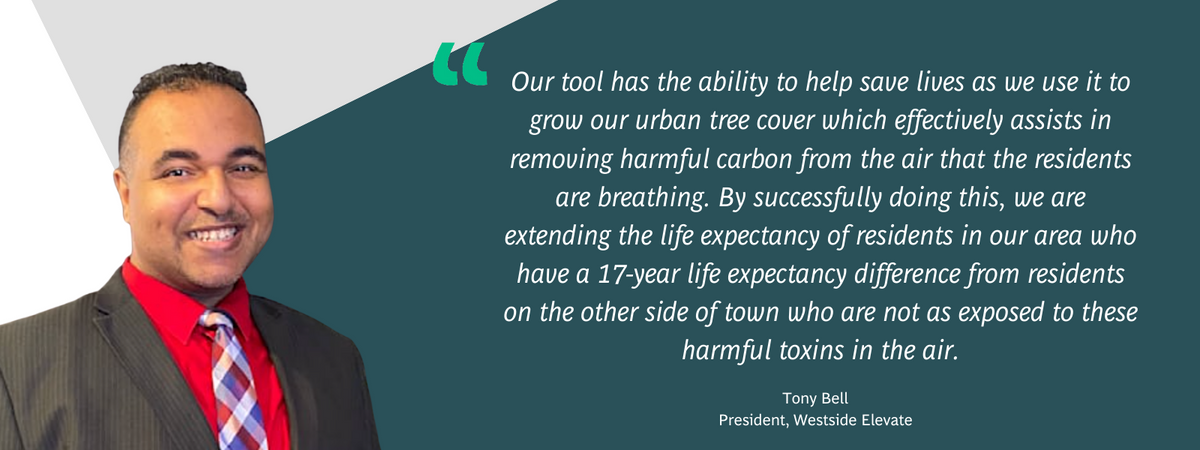
Community Partner: Puente Latino - Hilda Gaytan, Raul Nario, Roberto Cota , Kirk Davis, Raul Cedillo, Octavio Mojica , and Andrew Lopez. Nehyam Neighborhood Association - Jeff Rowe. Westside Elevate - Tony Bell. Renate Boronowsky
Google.org - Chris Reynolds, Jenny Lee, Katrina Gao, Loryn Hairston, Grace Yeung, Caroline Hsu, Murriel Perez McCabe, AJ Ortega, Shanti Hossain, Nick Sattele, Katy Strong
County Government - Barbara Marlin, Chris Floore, Kai Fan, Keith Moffett, Megan Flowers, Mohammad Islam, Paul Shannon, Rodney Miller
Community Partner: Community Enhancement Authority - Tedra Houston, Tonja Khabir
Google.org - Jade Fowler, Jeneuse Geula, Jin Yu, Mike K., Michael Moss, Brian Jung, Salil Banerjee, Soo-Rae Hong, Stephanie Fernandez, Tyler Bleuel, Dom Ekeledo, Rakhi Parekh
County Government - Cheriene Floyd, Ana Chammas, Akilah Martin Passe, Jorge Valens, Jose Lopez, Michelle Johnson, Arianne Oliva, Daniela Rodriguez, Jorge Olazabal, German Gonzalez, Thomas Hilpold, Jaime Shycko, Eric Sanchez, Javier Ruiz, Ernesto Garcia Del Rio
Community Partner: Urban Impact Lab - Marta Viciedo, Irvans Augustin, Jordan De Leon, Isabella Bru. Axis Helps - Alexina Prather
Google.org - John Wilson, Esteban Obando, Diana Marquez, Isaiah Fischer-Brown, Colin Rhoads, Arun Kannan, Pratibha Sriram, Frank Hernandez, Aishwarya Rajan, Alex Durán, Kaina Lisibach, Emilio Garcia, Andrew White
Lilian Coral, Bernardo Rivera Muñozcano, Kelly Jin
Gabriel Doss, Monika Mankiewicz, Sophia Tareen, Erin Hattersley, Aaron Ogle, Leslie Sistla, Jen Carter
Katya Abazajian, Harold Moore, Kate Christy, Ashleigh Fryer, Shannon Felton Spence, Cori Zarek
Katie Stenclik, Rebecca Ierardo, Grayson Wiles, Brian Zuluaga, Matt Collins, Brian McGough, Josh Walton, Elysa Neumann, Josh Sorin, Dan Vogel, Osborne Brown
Access the TOPC toolkit, a resource for people working in local governments to chart a path to transform public data into digital tools that address pressing local challenges while building participants’ skills for tech, design, and data use.